Data Storytelling - Operationalized for your Data Story
Chapter 1 - 5 from Dykes (2019)
Dykes (2019)
Dykes, B. (2019). Effective Data Storytelling: How to Drive Change with Data, Narrative and Visuals. John Wiley & Sons.
Chapter 1
Introduction to Driving Change through Insight
Chapter 2
Why Tell Stories with Data?
Chapter 3
The Psychology of Data Storytelling
Chapter 4
The Anatomy of a Data Story
Chapter 5
Data, The Foundation of Your Data Story
Which perspective of communication shall the project have?
You can communicate to the audience from the position of an
 Insider
or
 Outsider
What is the story telling position in your project?
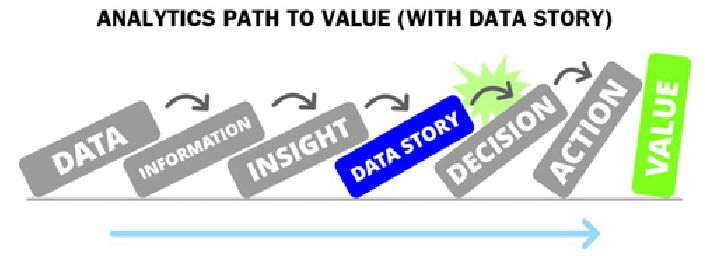
Path to value
Think about a potential role your project report could have (for your audience)
3 Essential Elements of Data Stories
Data, Visuals, Narrative
The three essential elements of data stories.
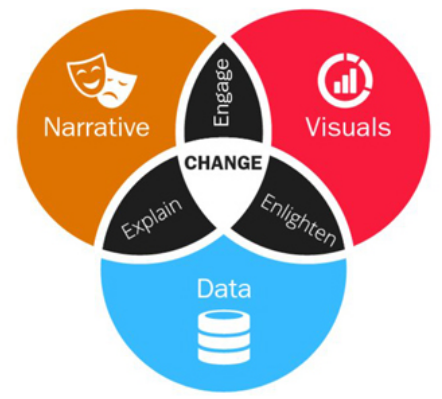
- Explain. Narrative coupled with data.
- What’s happening in the data?
- What is the context?
- Guide through the data structure!
- Why is a particular insight important?
- Enlighten. Visuals applied to data.
- Some insights are hard with numbers only.
- Show patterns and outliers otherwise hidden.
- Engage. Narrative and visuals merged together.
- Engage (or even entertain) an audience.
- Visuals capture interest, only a story holds attention.
Aristotle’s rhetoric
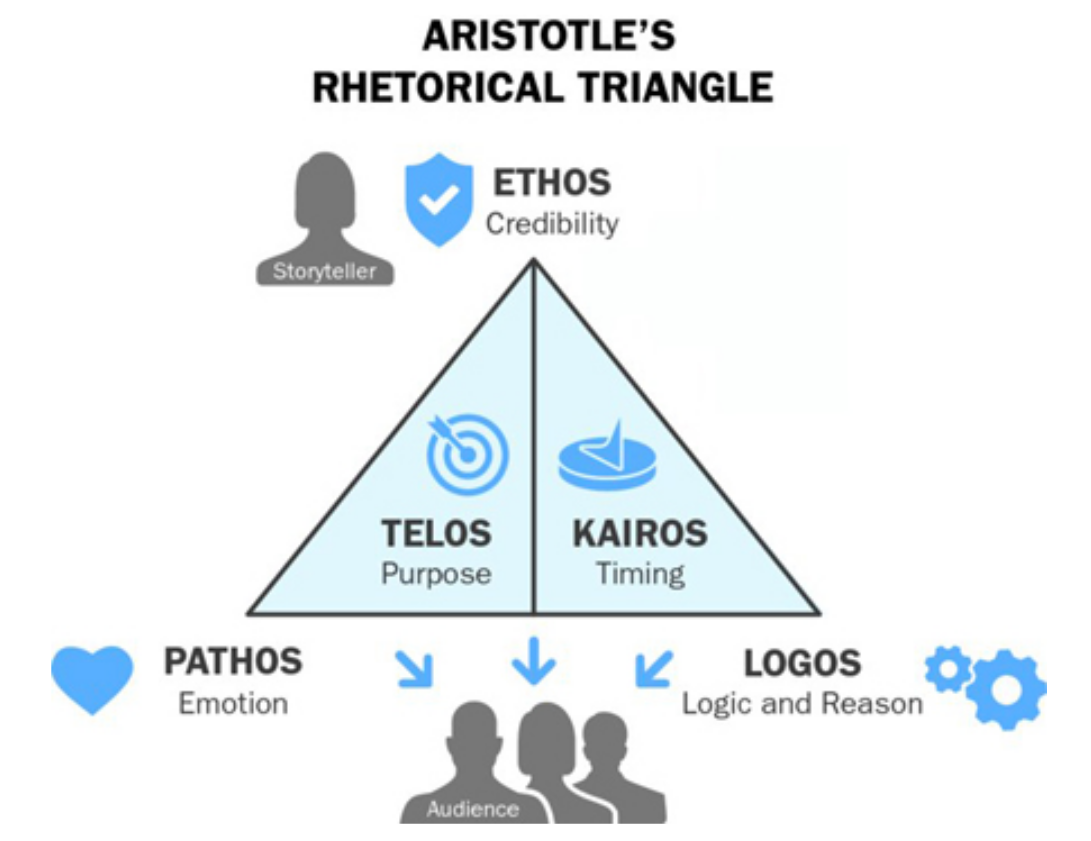
- Ethos an appeal to credibility
- Logos an appeal to logic or reason
- Pathos an appeal to emotion
- Telos an appeal to purpose
- Kairos an appeal to timeliness (opportune moment)
Aristotle’s rhetoric
Activity:
Check your potential story:
Can you address all these 5 rhetoric perspectives?
- Show credibility by not telling stories unrelated to data.
- What parts appeal to emotion, do you want to emphasize it, to make it relatable?
- Do you have logical reasoning for your main point?
- Can you make reference to timeliness.
- What is the main purpose of the story?
Data Story Continuum
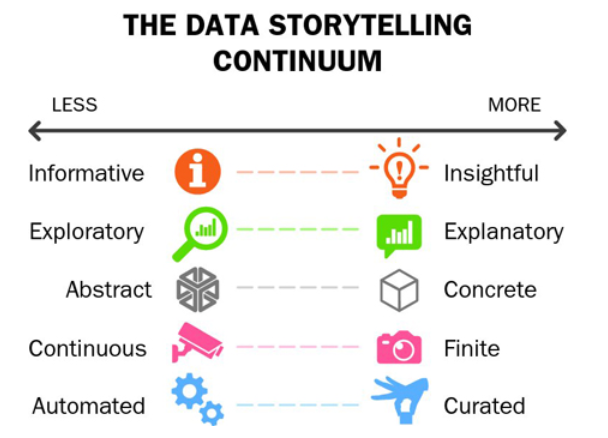
Five contrasting attribute pairs.
Try to bring visuals and story point to have attributes from the right!
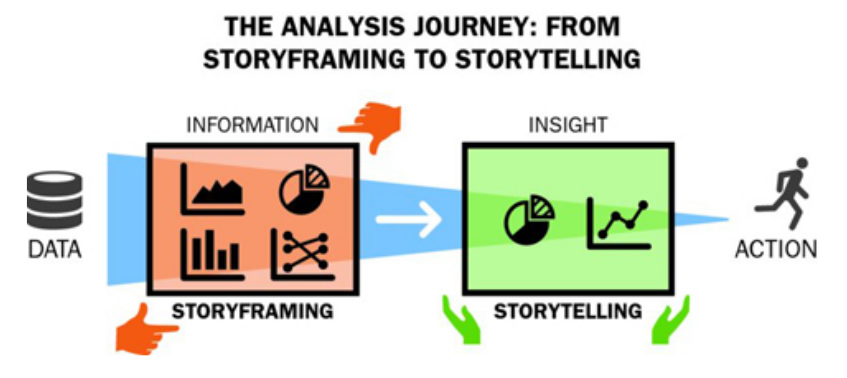
Storyframing before Storytelling
- Before you communicate insight, you must find one!
- Focus on key metrics and dimensions
Activity: Note potential key metrics in your data to frame your story.
Anatomy of a Data Story
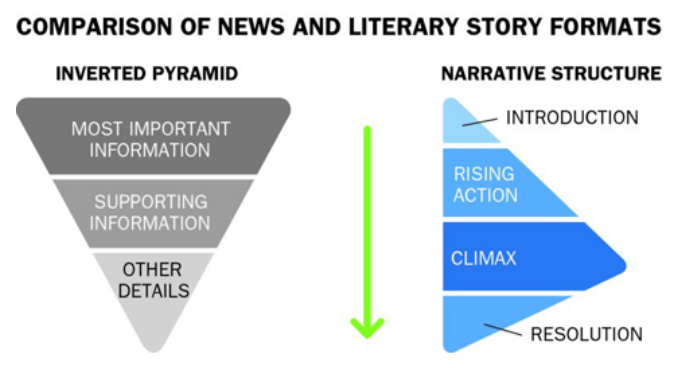
Different structure for two parts of your report
- Narrative structure for your slide deck and presentation
- Inverted pyramid structure for the written report
Six essential elements of data stories
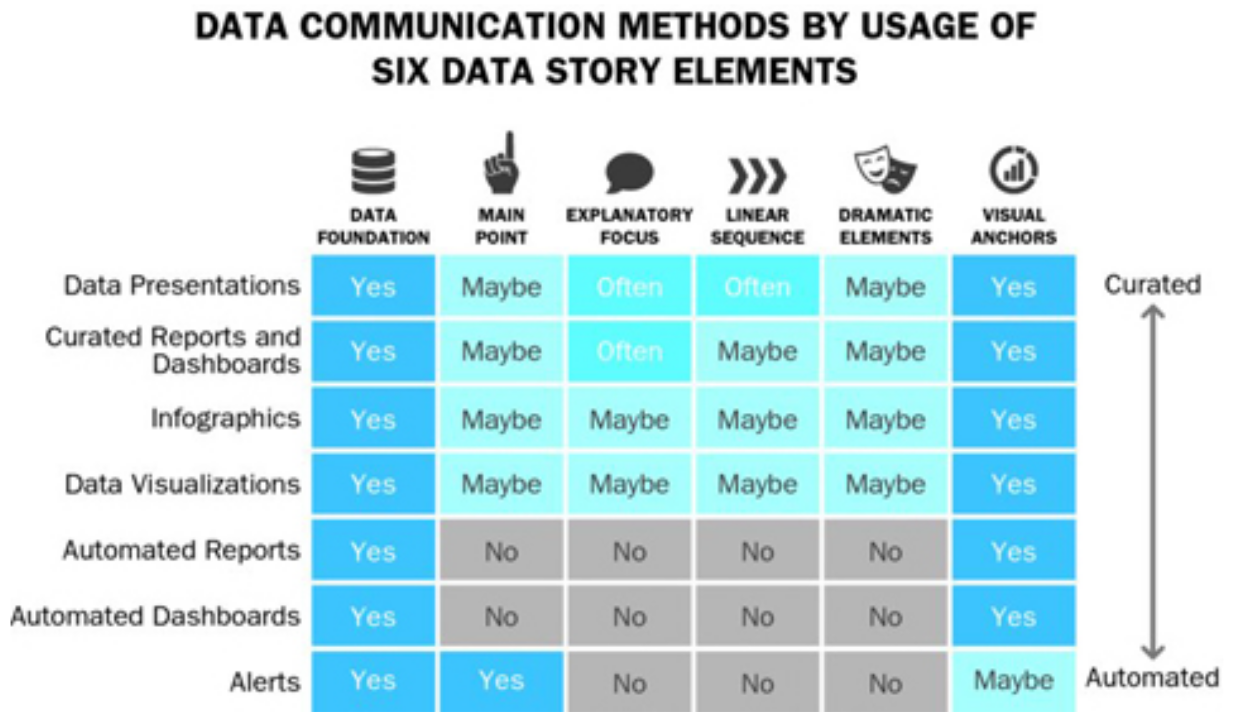
- Your project slide deck and presentation matches a Data Presentation
- Your project report matches a Curated Report (and Dashboard)
Differences in Communication
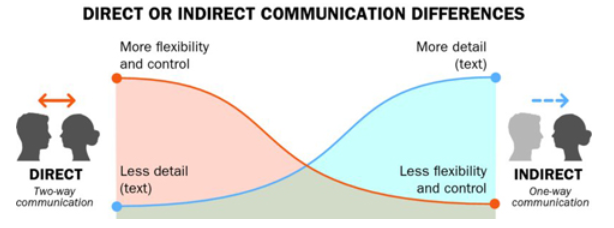
- Your project slide deck and presentation is direct communication
- Your project report is indirect communication
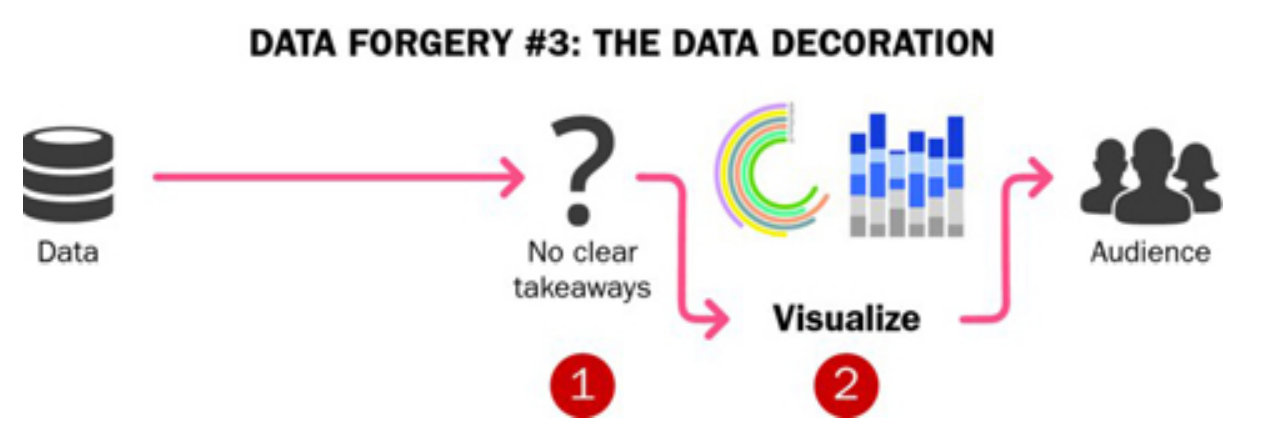
From Exploration to Explanation
Your new challenge: Come from explorattion to explanation!
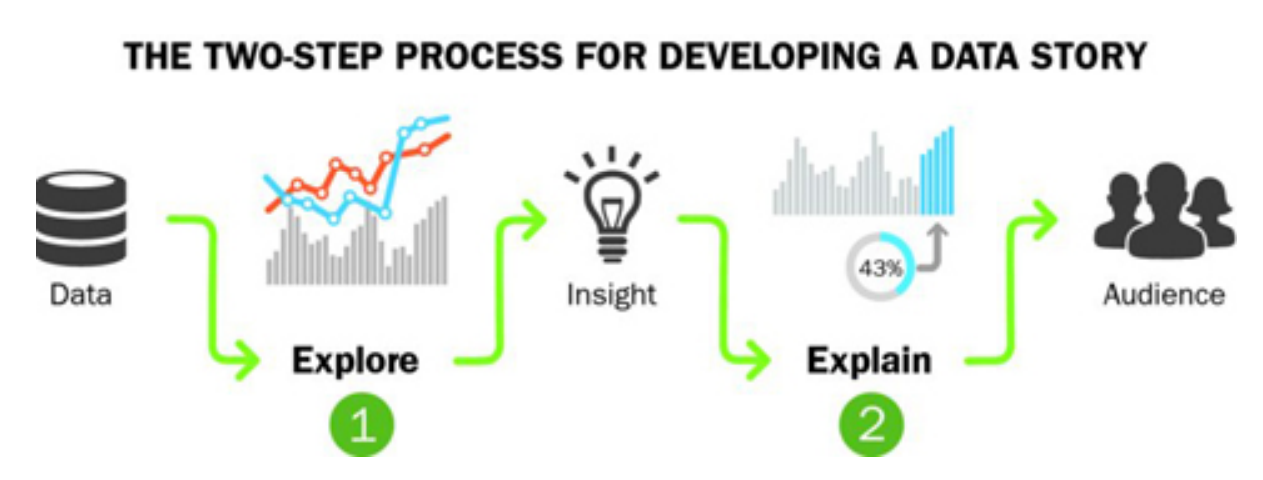
Once a meaningful insight is uncovered, explanatory data visualization shall be produced to tell the the story.
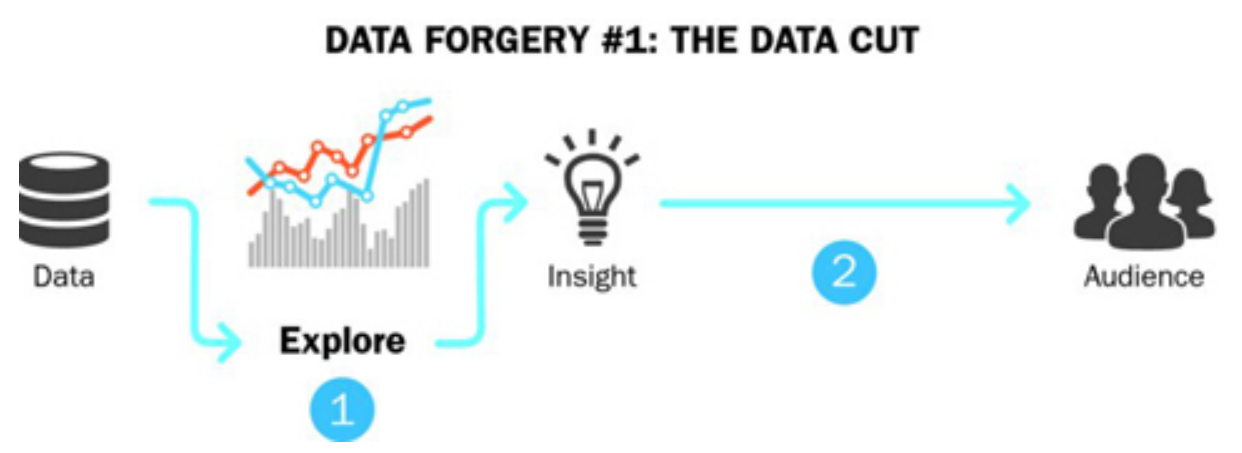
Data-Cut Trap
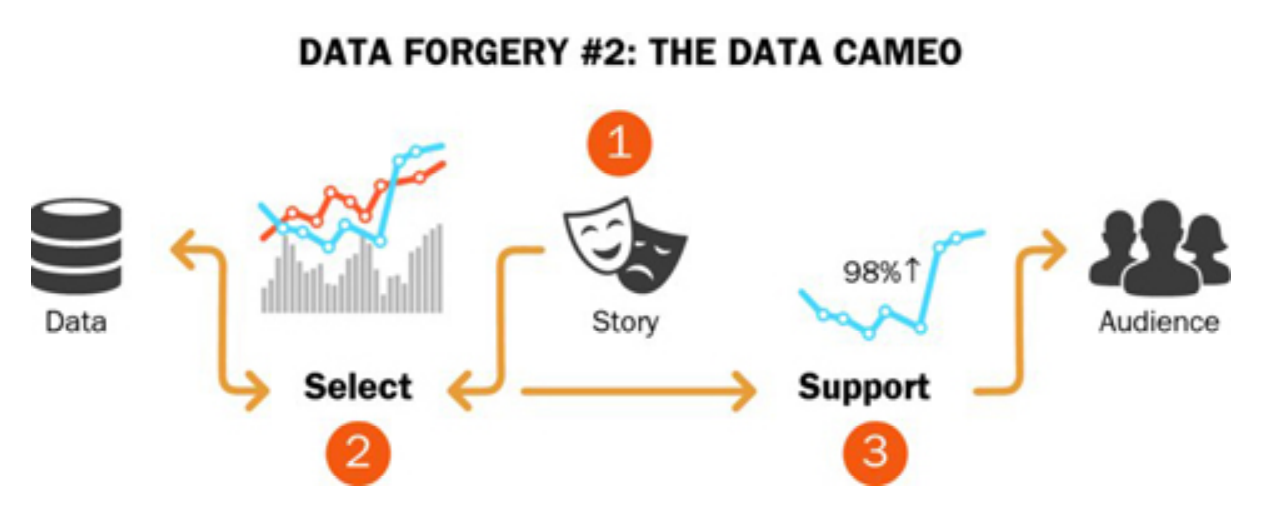
Data-Cameo Trap
Data-Decoration Trap