Data Storytelling - Storyboarding Activity Guide
Material mostly from Dykes (2019)
Data, Visuals, Narrative
The three essential elements of data stories.
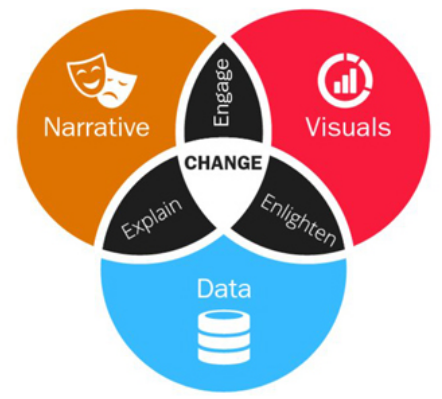
Storyboading is about a narrative and how it relates to data and visuals.
- Explain. Narrative coupled with data.
- What’s happening in the data?
- What is the context?
- Guide through the data structure!
- Why is a particular insight important?
- Enlighten. Visuals applied to data.
- Some insights are hard with numbers only.
- Show patterns and outliers otherwise hidden.
- Engage. Narrative and visuals merged together.
- Engage (or even entertain) an audience.
- Visuals capture interest, only a story holds attention.
Data Story Continuum
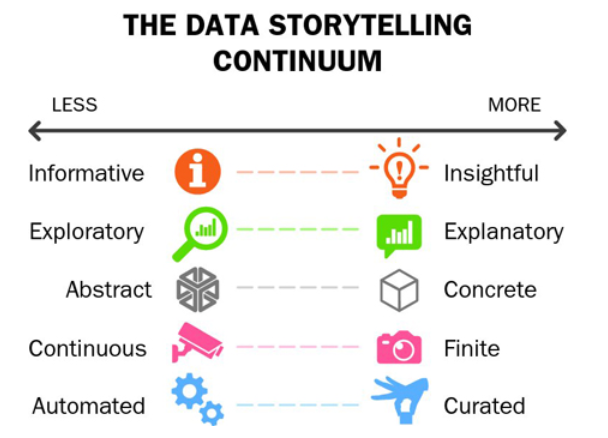
While storyboarding, make your story points with attributes from the right side.
Storyframing before
- Before you communicate insight, you must find one!
- Focus on key dimensions and find key metrics
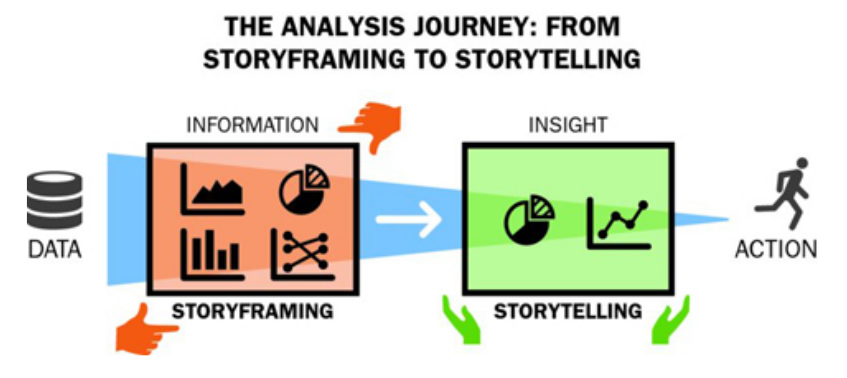
- While storyboarding, note open points for your storyframing.
- Open points can be discussed in individual meetings next week
Anatomy of a Data Story
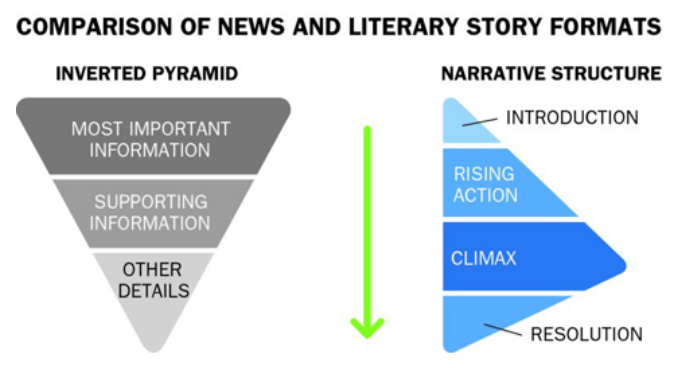
Different structure for two parts of your report
- Narrative structure for your slide deck and presentation
- Inverted pyramid structure for the written report
Six essential elements of data stories
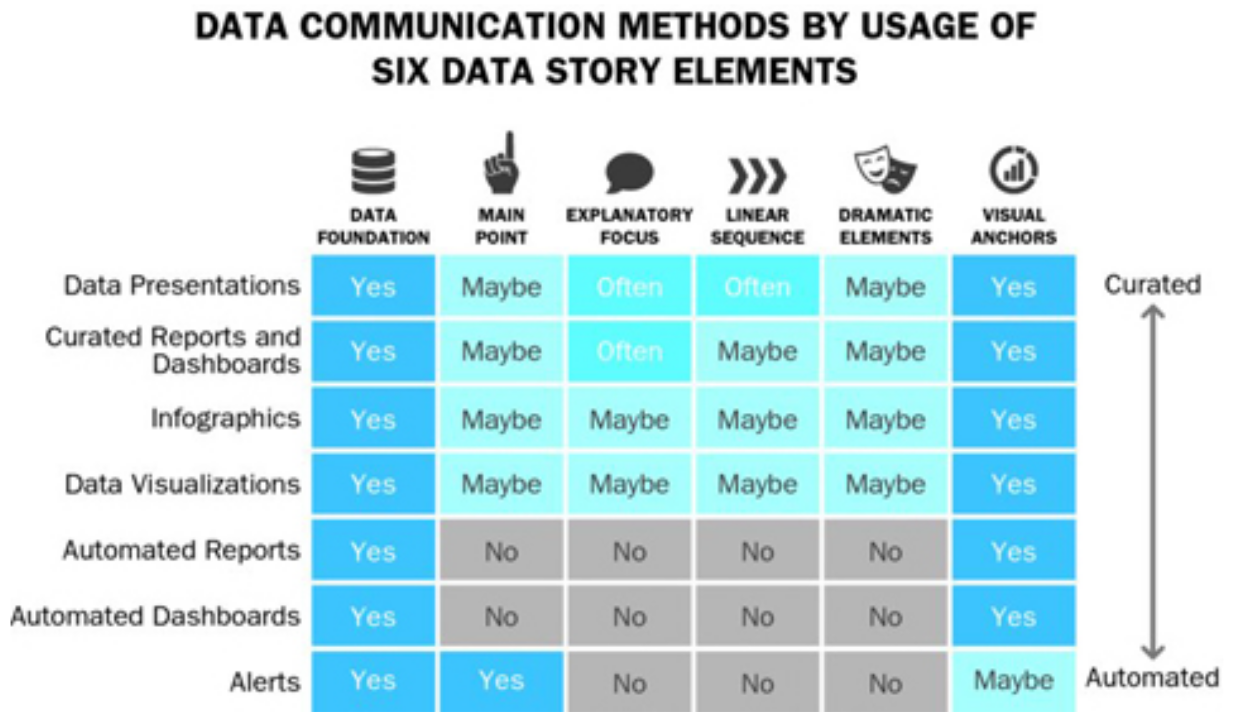
- Your project slide deck and presentation matches a Data Presentation
- Your project report matches a Curated Report (and Dashboard)
Differences in Communication
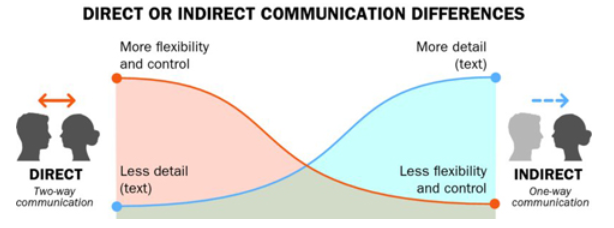
- Your project slide deck and presentation is direct communication
- Your project report is indirect communication
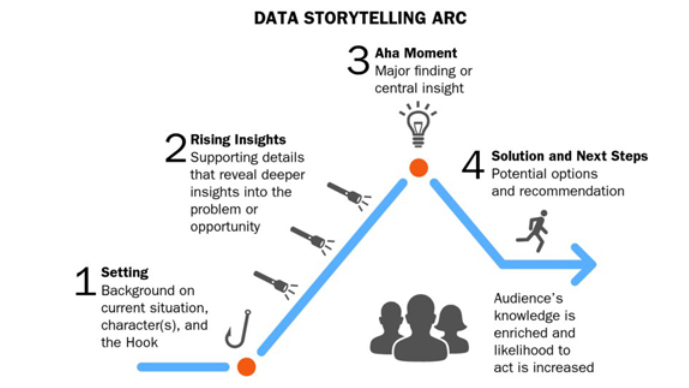
Data Storytelling Arc
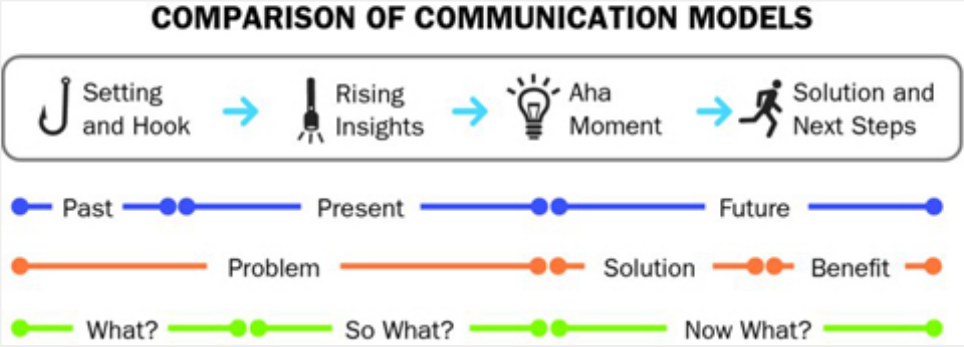
Compared to other communication models
Examples of story points
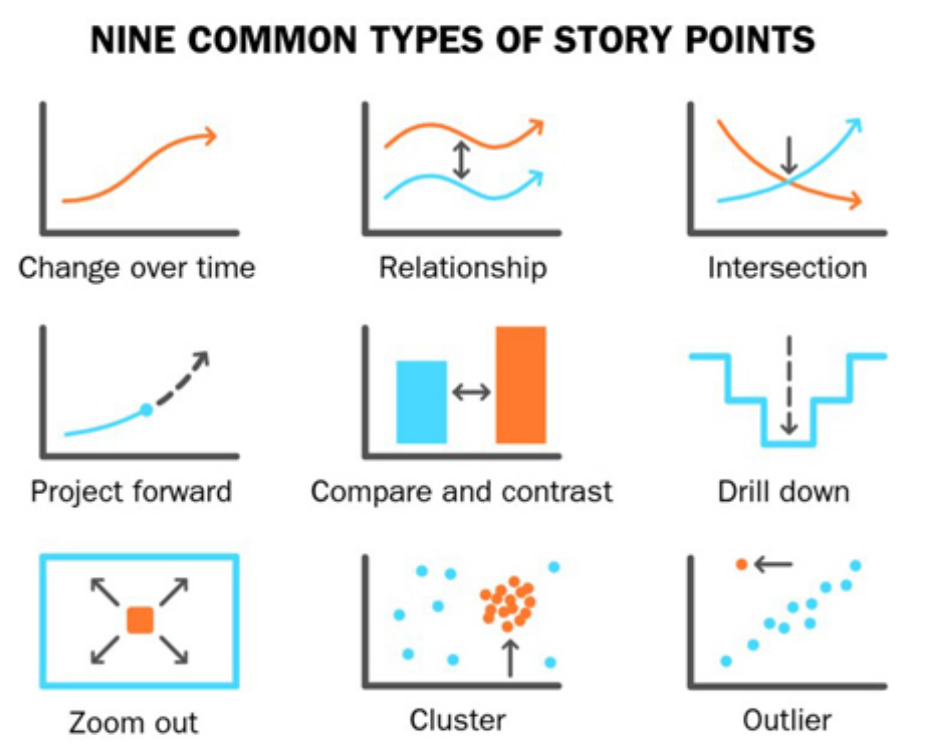
Activity: Check if your ideas fit into one of the categories and then improve on that premise. Alternatively: Get inspired by these.
Phase B: Storyboarding!
Activity: Realize these steps in your storyboard.
- Step 1: Identify your “Aha” moment (main insight)
- Step 2: Find your beginning (the setting and the “hook”)
- Step 3: Select your rising insights (narrative from the hook to the Aha moment)
- Step 4: Conclude with solutions, next steps, empowerment to action, …
When your storyboard is fixed
- write the titles down in your slide deck and
- start working on your final visuals such that they best support your story.